
Machine learning adoption has lagged in software development and operations (DevOps) due to the complexity of orchestration. Kubernetes helps simplify operations by offering a single platform for efficient ML workload management. This guide provides instructions for deploying ML models, auto-scaling configurations, resource management, and monitoring of ML workloads.
In this guide, the term server refers to a dedicated GPU server that is suitable for running ML workloads, including training and inference. GPU containers need direct access to a graphics accelerator, which a typical VPS without GPU passthrough or vGPU does not provide.
Why Use Kubernetes for Machine Learning?
Kubernetes has already proven its effectiveness in solving key challenges like:
- Dependency management for different environments.
- Adjusting to dynamic scaling of ML models.
- Efficient allocation of GPU resources.
- Capturing logs and monitoring orchestration.
The immediate advantages of employing Kubernetes for ML tasks are restated here.
- You get flexible resource scaling with Horizontal and Vertical Pod Autoscalers.
- Your workloads stay consistent and reproducible in defined environments.
- Efficiency is enhanced in scheduling as well as GPU resource utilization.
- Automating Kubeflow and Tekton consolidates the orchestration of ML pipelines.
Guide on Kubernetes and ML

Kubernetes has become a powerful tool for managing machine learning workloads at scale. Before diving into deployment and scaling strategies, let’s start with the basics of setup.
Setting Up Kubernetes for ML Workloads
Setting up a Kubernetes cluster for machine learning involves custom configuring worker nodes, networking, and resource management. This enables an independent, dynamic, and cost-effective setting that enables an ML engineer to dedicate maximum time to model building instead of technical upkeep.
Deploying Kubernetes on the server with GPU and cloud in platforms like AWS, GCP, and Azure further enhances the experience.
Below are some default configurations when setting up Kubernetes for ML workloads:
- Master Node: This accounts for the rest of the cluster management like scheduling and API handling.
- Worker Nodes: Conducting ML tasks alongside container management and workload scaling.
- Networking: Sets up the communication channels for pods, services, and storage.
- Storage Integration: Provides persistent storage of large datasets through volumes or external storage integration solutions.
Kubernetes makes resource management easier by reducing manual infrastructure setup for ML model deployment.
Prerequisites
Before proceeding, ensure you have the following:
- A hosting provider account with the necessary permissions
- SSH key pair for server access
- Basic understanding of Linux commands
Kubernetes Deployment with Kubeadm on Server in 4 Steps
To enable Kubernetes cluster on a server with Kubeadm, make sure to observe due process:
Prepare at least two servers (one master and one worker node) with the preferred settings below:
- OS: Ubuntu 24.04 LTS
- vCPU: 4
- RAM: 16GB
- Storage: 80GB SSD
- Firewall rules: the Kubernetes and Calico ports listed in Step 1 should be accessible between the nodes
Here’s a comprehensive guide to configuring the dedicated servers and deploying a Kubernetes cluster using Kubeadm for ML workloads.
Step 1: Server Setup
Select Ubuntu 24.04 LTS for the starting operating system.
Choose a server that has the following minimums:
- vCPU: 4
- RAM: 16 GB
- Storage: 80GB SSD
Next, configure the firewall rules. Open the ports below:
- Master node: 6443/TCP (Kubernetes API server), 2379–2380/TCP (etcd), 10250/TCP (kubelet API), 10257/TCP (kube-controller-manager), 10259/TCP (kube-scheduler)
- Worker nodes: 10250/TCP (kubelet API), 10256/TCP (kube-proxy), 30000–32767/TCP and UDP (NodePort services)
- All nodes (Calico networking): 179/TCP (BGP) and IP protocol 4 (IP-in-IP) between the nodes
For key pair assignment, either create a new SSH key pair or use an existing one, for instance, access.
Launching in Bulk: currently, a minimum of two servers must be launched (one master and one worker).
Considering cloud hosting? Check out our tutorial to choose the best fit for your ML workloads.
Step 2: Kubernetes Setup Components
Set the correct permissions for your private SSH key to ensure secure access:
chmod 600 /path/to/private_key
Connect to your server via SSH:
ssh -i /path/to/private_key ubuntu@server-ip
Run the commands below on every node (master and workers). Update the system and install dependencies:
sudo apt update && sudo apt upgrade -y
sudo apt install -y apt-transport-https ca-certificates curl gpg
Disable swap (by default, the kubelet does not start if swap is enabled) and enable IP forwarding:
sudo swapoff -a
sudo sed -i '/\sswap\s/ s/^/#/' /etc/fstab
echo 'net.ipv4.ip_forward = 1' | sudo tee /etc/sysctl.d/k8s.conf
sudo sysctl --system
Install the container runtime. Kubernetes no longer works with Docker Engine directly (dockershim was removed in v1.24), so the cluster needs a CRI runtime such as containerd. Kubernetes v1.37 requires containerd 2.3 or newer, while the containerd package in the Ubuntu 24.04 repositories is 1.7, so install the containerd.io package from Docker’s repository:
sudo install -m 0755 -d /etc/apt/keyrings
sudo curl -fsSL https://download.docker.com/linux/ubuntu/gpg -o /etc/apt/keyrings/docker.asc
sudo chmod a+r /etc/apt/keyrings/docker.asc
echo "deb [arch=$(dpkg --print-architecture) signed-by=/etc/apt/keyrings/docker.asc] https://download.docker.com/linux/ubuntu $(. /etc/os-release && echo "$VERSION_CODENAME") stable" | sudo tee /etc/apt/sources.list.d/docker.list
sudo apt update
sudo apt install -y containerd.io
Generate the default containerd configuration (it also enables the CRI plugin) and switch containerd to the systemd cgroup driver:
containerd config default | sudo tee /etc/containerd/config.toml > /dev/null
sudo sed -i 's/SystemdCgroup = false/SystemdCgroup = true/' /etc/containerd/config.toml
sudo systemctl restart containerd
Kubernetes packages installation. Add the official Kubernetes APT repository (pkgs.k8s.io) and install kubeadm, kubelet, and kubectl. This guide uses Kubernetes v1.37, the latest minor release at the time of writing. Each repository contains packages for one minor version only, so to install another supported version, change v1.37 in both URLs:
curl -fsSL https://pkgs.k8s.io/core:/stable:/v1.37/deb/Release.key | sudo gpg --dearmor -o /etc/apt/keyrings/kubernetes-apt-keyring.gpg
echo 'deb [signed-by=/etc/apt/keyrings/kubernetes-apt-keyring.gpg] https://pkgs.k8s.io/core:/stable:/v1.37/deb/ /' | sudo tee /etc/apt/sources.list.d/kubernetes.list
sudo apt update
sudo apt install -y kubelet kubeadm kubectl
sudo apt-mark hold kubelet kubeadm kubectl
sudo systemctl enable --now kubelet
Step 3: Initialize Kubernetes Cluster
Firstly, set up the master node. On the master node, run:
sudo kubeadm init --pod-network-cidr=192.168.0.0/16
Configure kubectl for master node:
mkdir -p $HOME/.kubesudo cp -i /etc/kubernetes/admin.conf $HOME/.kube/configsudo chown $(id -u):$(id -g) $HOME/.kube/config
Install Network Plugin (Calico). The manifest below is for Calico v3.33.0; check the Calico documentation for the current version:
kubectl apply -f https://raw.githubusercontent.com/projectcalico/calico/v3.33.0/manifests/calico.yaml
Step 4: Join Worker Nodes
Copy the join command and run on the master node:
kubeadm token create --print-join-command
Copy the output and run it on the worker node:
sudo kubeadm join <master-node-ip>:6443 --token <token> --discovery-token-ca-cert-hash sha256:<hash>
Verify nodes in cluster. On the master node, check if the worker has joined:
kubectl get nodes
Deploying an ML Model on Kubernetes
Here are the YAML files to deploy an ML workload (TensorFlow Serving) on your Kubernetes cluster.
1. Create a deployment (ml-model-deployment.yaml).
This deployment runs a TensorFlow Serving container with a pre-trained ML model. TensorFlow Serving loads the model named in MODEL_NAME from /models/<MODEL_NAME>. The CPU request is also required for the autoscaler configured below.
apiVersion: apps/v1
kind: Deployment
metadata:
  name: ml-model
  labels:
    app: ml-model
spec:
  replicas: 1
  selector:
    matchLabels:
      app: ml-model
  template:
    metadata:
      labels:
        app: ml-model
    spec:
      containers:
        - name: ml-model
          image: tensorflow/serving:latest
          env:
            - name: MODEL_NAME
              value: my_model
          ports:
            - containerPort: 8501
          resources:
            requests:
              cpu: "500m"
              memory: "512Mi"
            limits:
              cpu: "2"
              memory: "2Gi"
          volumeMounts:
            - name: model-storage
              mountPath: /models
      volumes:
        - name: model-storage
          persistentVolumeClaim:
            claimName: ml-model-pvc
2. Expose the deployment as a service (ml-model-service.yaml).
This exposes the ML model via a NodePort service.
apiVersion: v1
kind: Service
metadata:
  name: ml-model-service
spec:
  type: NodePort
  selector:
    app: ml-model
  ports:
    - protocol: TCP
      port: 8501
      targetPort: 8501
      nodePort: 30050
3. Persistent volume for model storage (ml-model-pv.yaml).
Stores the ML model on a persistent volume. A hostPath volume uses the local disk of the node where the pod runs, so place your exported SavedModel in /mnt/ml-models/my_model/1/ on that node (or use network storage in production).
apiVersion: v1
kind: PersistentVolume
metadata:
  name: ml-model-pv
spec:
  storageClassName: ""
  capacity:
    storage: 5Gi
  accessModes:
    - ReadWriteOnce
  persistentVolumeReclaimPolicy: Retain
  hostPath:
    path: "/mnt/ml-models"
4. Persistent volume claim (ml-model-pvc.yaml).
Define a persistent volume claim that connects your deployment to the volume:
apiVersion: v1
kind: PersistentVolumeClaim
metadata:
  name: ml-model-pvc
spec:
  storageClassName: ""
  volumeName: ml-model-pv
  accessModes:
    - ReadWriteOnce
  resources:
    requests:
      storage: 5Gi
5. Apply the configurations.
Run the following commands to deploy the ML model:
kubectl apply -f ml-model-pv.yamlkubectl apply -f ml-model-pvc.yamlkubectl apply -f ml-model-deployment.yamlkubectl apply -f ml-model-service.yaml
After deployment, check the running services:
kubectl get podskubectl get services
You can access the model at:
http://<SERVER-PUBLIC-IP>:30050/v1/models/my_model
This setup ensures that your TensorFlow Serving model is running on Kubernetes with persistent storage. To ensure reliable deployments, Kubernetes supports a variety of deployment strategies, including blue-green deployments, A/B testing, and rolling upgrades. Learn about the various Kubernetes deployment options and their advantages.
Configuring Autoscaling for ML Workloads
The workload in ML has fluctuating resource requirements, so scaling is important. For this purpose, Kubernetes offers the Horizontal Pod Autoscaler (HPA), which changes the number of running pods based on CPU and memory use, and the Vertical Pod Autoscaler (VPA, installed separately as an add-on), which adjusts the CPU and memory requests of individual pods. Along with these benefits, these practices ensure that resources are not overutilized while always being available.
Autoscaling relies on resource monitoring to scale in or out based on defined metrics. This Kubernetes for machine learning feature is very beneficial for ML operations that might spike request volume out of nowhere.
- Horizontal Pod Autoscaler (HPA): Changes the number of pod replicas in response to CPU or memory usage and some other optional metrics.
- Vertical Pod Autoscaler (VPA): This device alters resource assignment (CPU, memory) at the pod level depending on how much a particular pod is consuming.
- Cluster Autoscaler: This can increase/decrease the level of the worker nodes depending on how resource-heavy the overall demand on the cluster is.
Automation control makes Kubernetes help in scaling down cost while still delivering on performance needs for ML under diverse load conditions.
ML workloads tend to require changing amounts of resources. Kubernetes’ Horizontal Pod Autoscaler (HPA) enables scaling the number of replicas based on CPU or other self-defined metrics.
Refer to this guide on horizontal vs. vertical scaling to learn about the main distinctions and advantages of these strategies.
Below is an example HPA configuration that scales the ml-model deployment when 70% of the average CPU utilization is exceeded.
The HPA gets CPU usage from the Metrics API, which kubeadm does not install. Deploy metrics-server first. On a kubeadm cluster, kubelet serving certificates are self-signed by default, so for a test cluster add the --kubelet-insecure-tls flag (in production, enable signed kubelet serving certificates instead):
kubectl apply -f https://github.com/kubernetes-sigs/metrics-server/releases/latest/download/components.yaml
kubectl patch deployment metrics-server -n kube-system --type=json -p '[{"op":"add","path":"/spec/template/spec/containers/0/args/-","value":"--kubelet-insecure-tls"}]'
# wait about a minute until metrics are collected, then check:
kubectl top nodes
Create ml-model-hpa.yaml in the same namespace as the deployment:
apiVersion: autoscaling/v2
kind: HorizontalPodAutoscaler
metadata:
  name: ml-model-hpa
spec:
  scaleTargetRef:
    apiVersion: apps/v1
    kind: Deployment
    name: ml-model
  minReplicas: 1
  maxReplicas: 3
  metrics:
    - type: Resource
      resource:
        name: cpu
        target:
          type: Utilization
          averageUtilization: 70
Apply it:
kubectl apply -f ml-model-hpa.yaml
Check the status:
kubectl get hpa
Managing Resources for Efficient ML Execution
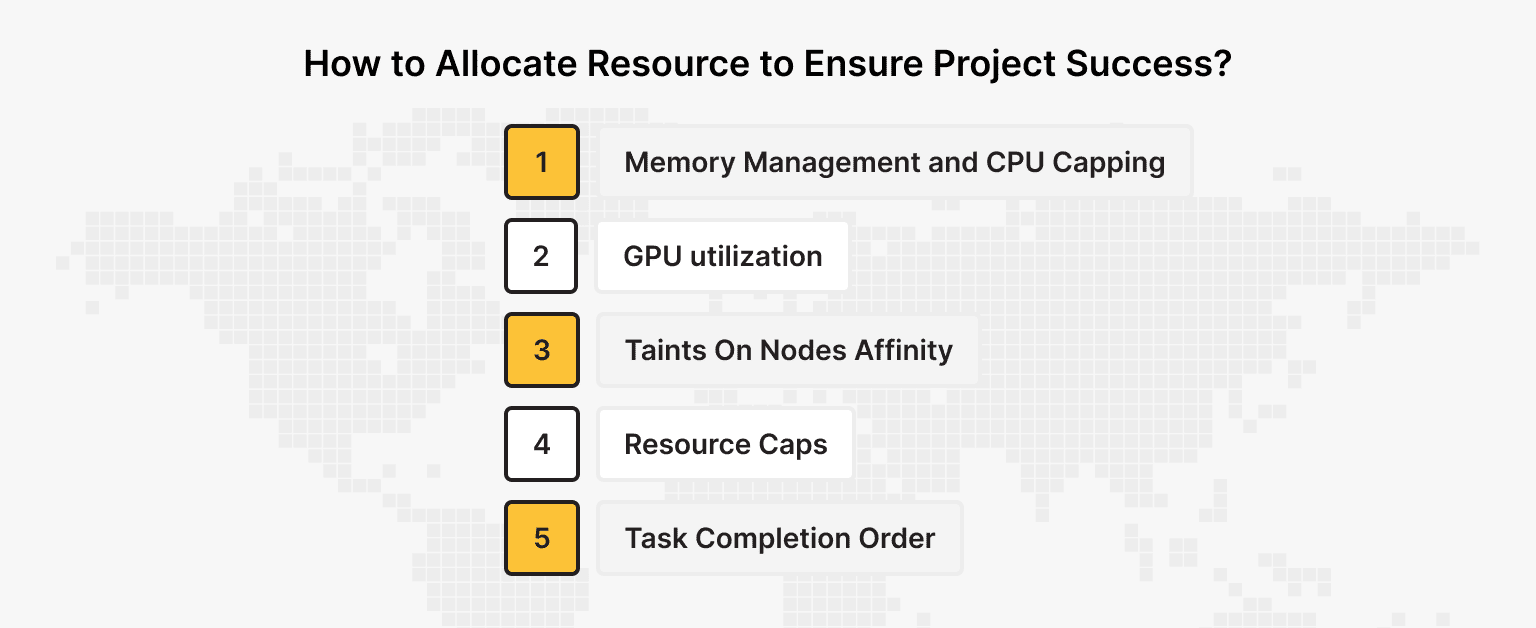
Resource usage in Machine Learning is heavy, often using a lot of CPU, memory, and even GPU. Resource allocation requests and limits in Kubernetes help to optimize ML execution. Maintaining resource management principles assures equal distribution across several ML processes and avoids resource starvation or overprovisioning.
Best practices for resource management:
- Memory Management and CPU Capping. Setting resource limits and ensuring employment of resources are balanced while avoiding node overload.
- GPU utilization during training, making inferences, and other arithmetic operations, efficiently manages GPU resources and makes training and inference better.
- Taints On Nodes Affinity. Fitting specific workloads on certain nodes to utilize to fit resource needs.
- Resource Caps. Allocating cap limits to resource use within a particular namespace to control resource monopolization.
- Task Completion Order. High-priority ML workloads should be given resources, lowering the importance of some tasks.
All resources above ensure the optimal ML model runs with the least latency and highest performance. Allocating resources boosts the efficiency of ML workloads and prevents GPU's inefficient usage of resources with overloading nodes.
Example configuration with requests and resource limits:
resources:
  requests:
    cpu: "500m"
    memory: "512Mi"
  limits:
    cpu: "2"
    memory: "2Gi"
With automated scaling and resource management integration, Kubernetes stands out for its containerized deployment environment. It offers support for complex ML workflows, including model serving, distributed training, and data processing pipelines.
Monitoring and Logging ML Workloads in Kubernetes
Monitoring ML workloads ensures models run efficiently and any failures are quickly detected. We can use Prometheus and Grafana for monitoring and an EFK stack (Elasticsearch, Fluent Bit or Fluentd, and Kibana) for logging.
Performance, reliability, and issue resolution within Machine Learning workloads critically depend on monitoring and logging. Kubernetes has both internal functions as well as external services which help ensure an observability level across ML models, training jobs, and inference services.
Kubernetes ML observation techniques:
- Set Up Resource Limits: Specify the requests and limits for CPU, memory, and GPU to ensure that ML jobs do not flood the cluster.
- Log All Training and Inference Events: Save logs for training models and performing inference to enable debugging.
- Use Custom Metrics for ML: Define application-specific metrics like model accuracy, inference latency, and request throughput as metrics.
- Enable Persistent Logging: Store logs centrally to ensure persistence over time and to analyze the failures better.
- Combining these logging and monitoring techniques helps organizations leverage Kubernetes' full potential regarding ML workload performance, reliability, and availability.
Important Components of ML Monitoring in Kubernetes
Gathering Performance Indicators
Kubernetes provides resource usage metrics such as CPU, memory, and GPU that are critical to the efficient monitoring of ML workloads within the system.
Real-time collection of data on pod and node performance is usually done using Prometheus.
Trends and performance issues over time can be visualized using interactive dashboards provided by Grafana.
Log Management and Error Tracking
Logs from multiple pods and nodes can be collected and analyzed with the EFK stack (Elasticsearch, Fluent Bit or Fluentd, Kibana).
Collective infrastructure, Cloud logging Services provided by AWS Cloudwatch, GCP Cloud Logging, and Azure Monitor serve the purpose of log centralization and analysis.
Failure Reporting Interfaces
Prometheus integrated with Alertmanager sends alerts for spikes in CPU usage, memory leaks, or failing models when previously defined thresholds are crossed.
Problems can be escalated in real time through notifications sent via Slack, PagerDuty, or emails.
Dedicated Server
This ideal solution for large-scale projects offers unbeatable protection, high performance, and flexible settings.
Step-by-step Setup of Monitoring and Logging Tools
Step 1: Deploy Prometheus and Grafana. Use the kube-prometheus release branch that supports your Kubernetes version (release-0.19 covers Kubernetes 1.35–1.37). The CRDs are applied with server-side apply because they are too large for a regular apply:
git clone --depth 1 --branch release-0.19 https://github.com/prometheus-operator/kube-prometheus.git
cd kube-prometheus
kubectl apply --server-side -f manifests/setup
kubectl wait --for condition=Established --all CustomResourceDefinition --namespace=monitoring
kubectl apply -f manifests/
Step 2: Deploy the logging stack. The old fluentd-elasticsearch add-on has been removed from the Kubernetes repository, and Elastic recommends running Elasticsearch and Kibana on Kubernetes with the ECK operator. Elasticsearch stores data on a persistent volume, so the cluster needs a default StorageClass. On a bare kubeadm cluster, you can use local-path-provisioner. Install Helm, the storage provisioner, the ECK operator, and Elasticsearch with Kibana:
curl -fsSL https://raw.githubusercontent.com/helm/helm/main/scripts/get-helm-4 | bash
kubectl apply -f https://raw.githubusercontent.com/rancher/local-path-provisioner/v0.0.37/deploy/local-path-storage.yaml
kubectl patch storageclass local-path -p '{"metadata": {"annotations":{"storageclass.kubernetes.io/is-default-class":"true"}}}'
helm repo add elastic https://helm.elastic.co
helm repo update
helm install elastic-operator elastic/eck-operator -n elastic-system --create-namespace
helm install eck-stack elastic/eck-stack -n elastic-stack --create-namespace
Then ship container logs with Fluent Bit, a lightweight log collector from the Fluentd project. Create fluent-bit-values.yaml so that it sends logs to the Elasticsearch cluster created by ECK:
env:
  - name: ES_PASSWORD
    valueFrom:
      secretKeyRef:
        name: elasticsearch-es-elastic-user
        key: elastic
config:
  outputs: |
    [OUTPUT]
        Name               es
        Match              kube.*
        Host               elasticsearch-es-http
        Port               9200
        HTTP_User          elastic
        HTTP_Passwd        ${ES_PASSWORD}
        tls                On
        tls.verify         Off
        Logstash_Format    On
        Suppress_Type_Name On
        Replace_Dots       On
        Retry_Limit        False
Install Fluent Bit in the same namespace (it reads the Elasticsearch password from the secret created by ECK):
helm repo add fluent https://fluent.github.io/helm-charts
helm repo update
helm install fluent-bit fluent/fluent-bit -n elastic-stack -f fluent-bit-values.yaml
Step 3: After running these commands, verify that Prometheus and the logging components are running:
kubectl get pods -n monitoring
kubectl get pods -n elastic-stack
To open Kibana, forward its port and log in as elastic with the password from the ECK secret:
kubectl get secret elasticsearch-es-elastic-user -n elastic-stack -o jsonpath='{.data.elastic}' | base64 -d
kubectl port-forward -n elastic-stack svc/eck-stack-eck-kibana-kb-http 5601
Kibana will be available at https://localhost:5601 on the machine where you run kubectl. To open it from your computer, connect to the server with SSH port forwarding (for example, ssh -L 5601:localhost:5601 ubuntu@server-ip).
You will then be able to monitor the status of ML loads, identify bottlenecks, and respond to critical incidents in a timely manner.
Conclusion
Kubernetes offers a powerful and flexible way to manage machine learning workloads — from automation to scaling and resource optimization. ML teams can leverage Kubernetes for machine learning to efficiently deploy, scale, and monitor complex workflows with minimum downtime and optimal resource utilization.
With Prometheus, HPA, and GPU-aware scheduling for monitoring, dynamic scaling, and ML acceleration, respectively, Kubernetes provides a seamless infrastructure for ML workloads.
Organizations wishing to efficiently manage and optimize Kubernetes for fully automated and computationally efficient machine learning systems as workloads and business needs evolve will have no other choice but to adopt Kubernetes for machine learning as the complexity of ML applications rises. These recommendations will help teams develop efficient, scalable, and robust ML systems.
Dedicated Server
Reliable operation, high performance, and everything you need to host machine learning based projects — get started now.
From $75.00/mo